Breeding shorebird surveys within each Bird Conservation Region of Alaska
Breeding shorebird surveys that have been conducted over large areas or islands within each Bird Conservation Region of Alaska (ordered by number [No.] below), including study area size and effort, dominant species surveyed, survey type, estimate of shorebird abundance at each site, year(s) of study, and reference.
Northern Pacific Rainforest Bird Conservation Region 5
| No. | Site | Study Area Size (effort) | Dominant Species2* | Survey Type3 | Measure of Abundance4 | Year(s) of Study | Reference(s) |
|---|---|---|---|---|---|---|---|
| 35 | Kenai Fjords National Park | Unknown (5 transects) | BLOY | Boat-based coast survey, 20-km transects | D: 0.05–0.09 nests/km | 2007– 2016 | Coletti et al. 2017 |
| 36 | Southwestern Prince William Sound | Unknown (5 transects) | BLOY | Boat-based coast survey, 20-km transects | D: 0.06–0.13 nests/km | 2007– 2016 | Coletti et al. 2017 |
| 37 | Prince William Sound | 10,000 km2 (185 transects) | BLOY | Boat-based coast survey, random line transects | P: 709 ± 223 ind (95% CI) | 1989 –1993 | Agler et al. 1999 |
| 38 | Western Prince William Sound | 4,660 km shoreline (1,943 km, 18 transects) | BLOY | Boat-based coast survey, transects, 21–254 km long | N: 291 obs, 94 territories D: 0.03–0.38 pairs/km | 2000– 2004 | Poe et al. 2009 |
| 39 | Eastern Prince William Sound (Nelson Bay to Knoll’s Head, Red Head to Galena Bay) | 2001: 300 km, 2002: 110 km | BLOY | Boat-based coast survey, all shoreline | N: 2001: 8 nests + 3 ind obs; 2002: 31 nests + 5 obs | 2001, 2002 | Meyers and Fode 2001, Meyers 2002 |
| 40 | Prince William Sound focus on Hinchinbrook and Hawkins Islands, College Fiord/Port Wells, Cochrane Bay, Blackstone Bay, shoreline between eastern Valdez Arm and Cordova | Unknown (1,300 km of surveys) | BLOY | Boat-based coast survey, some beach walks | N: 101 territories | 2007– 2009 | Poe et al. 2013 |
| 41 | Prince William Sound | Unknown (8–9 transects/year over 46 regions) | BLOY | Boat-based survey, split panel, rotating design, 20-km transects | N: 12–21 territories/year; 317 obs over all years | 2012– 2017 | Cooper 2013; Cooper and Gabrielson 2012; Gabrielson 2014, 2015a, 2016, 2017 |
| 42 | Middleton Island | 12.95 km2 (all coastline) | BLOY | Land-based coast survey, monthly counts (April– September, February) | P: 781, 716, 703 ind maximum in 2004–2006, respectively D: ave. 9.8 pairs/ km in 2004 and 2005 | 2002, 2004– 2006 | Gill et al. 2004; Guzzetti 2008 |
| 43 | Eastern Copper River Delta | >225 km2 (52 km, 11 transects) | LESA, RNPH, SBDO, WISN | Repeated belt transects 3–9 km long, 30 m wide, rope drag on some transects | D: 20.5–28.8 nests/km2 for all shorebirds | 1978, 1979 | Mickelson et al. 1980 |
| 44 | Glacier Bay | Unknown (1,203 km of surveys) | BLOY (3 other less common) | Boat-based and ground surveys, focus on human disturbance sites | N: BLOY = 124–205 pairs4a | 2003– 2005 | Arimitsu et al. 2007 |
| 45 | Glacier Bay, Beardslee Islands | Unknown (all coastline) | BLOY | Boat- and beach-based surveys | N: 66 territories | 2005 | Tessler and Garding 2005 |
| 46 | Sitka Sound | Unknown (25 sites) | BLOY | Area search, revisit Webster sites and others | N: 8 pairs | 2007 | Andres and Christensen 2009 |
Northwestern Interior Forest Bird Conservation Region 4
| No. | Site | Study Area Size (effort) | Dominant Species2* | Survey Type3 | Measure of Abundance4 | Year(s) of Study | Reference(s) |
|---|---|---|---|---|---|---|---|
| 30 | Southern Nulato Hills1b | 5,100 km2 (596 points on 19 grid cells; intensive plot) | BTCU, AMGP, PAGP, SURF, WISN, WHIM (other less common) | Random 10 km x 10 km grid, point counts plus intensive validation plot for BTCU | P: 2,000 pairs of BTCU (CI: 700–3,300); no estimates made for other species | 1989, 1991, 1999 | Handel, unpubl. data in Marks et al. 2002; Handel, Gill, McCaffery et al., unpubl. data |
| 31 | Southern Nulato Hills1b | 5,100 km2 (249 points at 16 sites) | BTCU, WHIM, PAGP, BARG, other species | Systematically distributed sites, point counts | N: BTCU = 228 obs; WHIM = 121 obs | 2012 | K. Sowl, unpubl. data |
| 32 | Donnelly and Tanana Flats Training Area | Unknown (220 plots) | WISN, LEYE, SPSA, WHIM, SOSA (7 other less common) | Modifed PRISM, 16-ha plots | N: 1–216 obs/ species; O: 0.32 occupancy estimate | 2017 | E. Martin, unpubl. data |
| 33 | Upper Susitna River Watershed | 2,076.5 km2 (>2,500 points) | WISN, LEYE, AMGP, RNPH, LESA (7 other less common) | Random grids by vegetation strata, point counts | N: 1–337 obs/ species; O: <0.001–0.235 detections/1,434 counts | 2013, 2014 | ABR 2018 |
| 34 | Interior Road System (Dalton, Denali, Elliot, Parks, Richardson, Steese, and Taylor, Highways; Stampede Road) | Unknown (279 points on 28 transects) | WHIM, WISN (9 other less common) | Non-random transects, point counts, 2–21 points/ transect | N: 1 species on 63 points; 0 obs on 203 points | 2013 | Harwood 2016 |
Western Alaska Bird Conservation Region 2
| No. | Site | Study Area Size (effort) | Dominant Species2* | Survey Type3 | Measure of Abundance4 | Year(s) of Study | Reference(s) |
|---|---|---|---|---|---|---|---|
| 7 | Seward Peninsula and W Norton Sound | 4,500 km2 (2814 point counts at 1035 points on 39 grid cells, intensive plots) | BTCU, AMGP, PAGP, WHIM, BARG, WESA, WISN (4 other less common) | Random 10 km x 10 km grid, point counts plus intensive validation plot for BTCU | P: 1,200 breeding pairs of BTCU on Seward Peninsula (CI: 500-1,900); D: 0.03–1.18 birds/point for other species | 1988– 1992, 2000 | Handel, unpubl. data in Marks et al. 2002; Tibbitts et al. 2006; Handel, Gill, & Tibbitts, unpubl. data |
| 8 | Seward Peninsula | 3,500 km2 (247 points on 14 grid cells) | AMGP, BTCU, WESA, WHIM, WISN, PAGP, BARG (9 other less common) | Stratifed subset of random 10 km x 10 km grids sampled in 1988, 1989, 2000; replicated point counts | N: 1–303 obs over all points and years; predicted abundance (detections) per point relative to habitat | 2012– 2014 | Thompson et al. 2016 |
| 9 | Seward Peninsula | 67,500 km2 (106 polygons) | REKN, AMGP (10 other less common) | Area search, 10–338-ha polygons on ridges and domes | O: REKN present at 27% of polygons | 2011 | Johnson et al. 2011a |
| 10 | Yukon Delta National Wildlife Refuge | 55,336 km2 (621 rapid plots, intensive plots) | WESA, RNPH, DUNL, WISN, BARG, BLTU, LESA, BBPL, LBDO, ROSA, SESA, WHIM, PAGP, SBDO (12 other less common) | PRISM, 16-ha plots plus intensive validation plots | P: 4,720,396– 8,321,746 ind | 2015, 2016 | R. Lanctot, unpubl. data |
| 11 | Yukon Delta (Hazen Bay area) | 853 km2 (78 rapid plots at 9 clusters, intensive plots) | DUNL, RNPH, SESA, WESA, BLTU, BARG, ROSA, BBPL, WISN | Mostly Random PRISM, 9–14- ha plots; plus intensive validation plots | P: 309,371 ind (CV = 0.11) | 2002 | McCaffery et al. 2012 |
| 12 | Yukon-Kuskokwim Delta (Aerial: Central Coast; Ground: Angyoyaravak Bay) | ~3,800 km2 (556 km aerial transect, 25 ground transects) | BLTU | Aerial and ground-based surveys, ground transects 1.2–11.2 km long | P: 80,000 ind (CI = 61,000– 99,000) | 1978– 1982 | Handel and Gill 1992 |
| 13 | Yukon River (Holy Cross to Emmonak)1a | 520–700 km of river/year (650– 865 points/year) | WISN, LEYE, SOSA, SPSA (5 other less common) | Boat-based point counts | N: 12–124 obs/ species | 1998, 2000, 2002 | Harwood 1999, 2001, 2003 |
| 14 | Kuskokwim River (Aniak to Bethel)1a | >483 km of river (590–598 points/ year) | WISN, LEYE, SOSA, SPSA (5 other less common) | Boat-based point counts | N: 17–72 obs/ species | 1999, 2001 | Harwood 2000, 2002 |
| 15 | Alaska Peninsula Lowlands (points from Upper Naknek River to end of Alaska Peninsula) | 23,100 km2 (792 points on 52 grid cells) | DUNL, WISN, SBDO, LESA, RNPH (8 other less common) | Random 5 km x 5 km grid, point counts, all plots with ?15% of area <100 m elevation | D: 0.5–1.5 ind/ point for 5 common species | 2004– 2007 | Savage et al. in review |
| 16 | Alaska Peninsula | Unknown (51 rapid plots at 6 sites) | DUNL, WISN, RNPH, SBDO, GRYE (6 other less common) | Non-random PRISM, most 16-ha plots | P: 1,803,925 ind (CV = 0.32) | 2002 | McCaffery et al. 2012 |
| 17 | Katmai and Lake Clark National Park and Preserve | 15,175 km2 (885 points on 54 grid cells) | AMGP, SEPL, GRYE, LEYE, WHIM, SURF, LESA, WISN (9 other less common) | Random 10 km x 10 km grid, point counts | D: 0.001–0.093 ind/point | 2004– 2006 | Ruthrauff et al. 2007 |
| 18 | Aniakchak National Monument and Preserve | 2,433 km2 (136 points on 8 grid cells) | SEPL, LESA, ROSA, WISN (7 other less common) | Random 10 km x 10 km grid, point counts | N: 1–126 obs/ species | 2008 | Ruthrauff and Tibbitts 2009 |
| 19 | Outer Shumigan Islands (south of Alaska Peninsula) | Unknown (2–4 surveys on coast) | BLOY | Boat-based, followed by beach surveys | D: 0.1–2.5 pairs/ km2 | 1994, 1995 | Byrd et al. 1997 |
| 20 | Izembek NWR isthmus (road corridor from Cold Bay to King Cove) | 40 km2 (120 points) | ROSA, DUNL, SEPL, LESA, RNPH, WISN, SBDO | Systematic grid of point counts | D: ROSA 2.8 ind/ point | 2007– 2009 | K. Sowl, unpubl. data |
| 21 | Kodiak Island | ~400–~1000 km coastline/year | BLOY | Boat-based coast survey | P: ~1,350–1,750 ind | 1994– 2005 | D. Zwiefelhofer, unpubl. data in Tessler et al. 2014 |
| 22 | Kodiak Archipelago | 1,465 km2 (nearshore only; 150 nearshore and 11 offshore island transects) | BLOY | Boat-based coast survey, systematic, 2.5–5-km transects | P: June: 1,410 (CI: 1,191–1,629); P: August: 3,402 (CI: 1,991–4,814) | 2011– 2013 | Corcoran 2016 |
| 23 | Katmai National Park and Preserve | Unknown (5 sites) | BLOY | Boat-based coast survey, 20-km transects | D: .06–0.12 nests/km | 2006– 2016 | Coletti et al. 2017 |
Aleutian/Bering Sea Islands Bird Conservation Region 1
| No. | Site | Study Area Size (effort) | Dominant Species2*Site | Survey Type3 | Measure of Abundance4 | Year(s) of Study | Reference(s) |
|---|---|---|---|---|---|---|---|
| 1 | St. Matthew and Hall Islands | 330 km2 (200.3 km of transects) | ROSA | Systematic, line transects | P: 13,480–17,289 ind | 2003 | Ruthrauff et al. 2012 |
| 2 | St. Paul Island | 109 km2 (205.1 km of transects) | ROSA | Systematic, line transects | P: 988–1469 ind | 2001 | Ruthrauff et al. 2012 |
| 3 | St. George Island | 90 km2 (170.6 km of transects) | ROSA | Systematic, line transects | P: 2155–3022 ind | 2002 | Ruthrauff et al. 2012 |
| 4 | Eastern Aleutians | 4,917.5 km2 (68 islands) | BLOY | Boat or beach surveys, observations from cli?s | N: 998 obs | 1980– 1981 | Nysewander et al. 1982 |
| 5 | Eastern Aleutians (Adak, Amlia, and Avatanak Islands) | 9,243 km2 (60 rapid plots at 3 clusters) | ROSA2a | Non-random PRISM, 16-ha plots | P: 61,602 ind (CV = 0.58) | 2002 | McCaffery et al. 2012 |
Arctic Plains and Mountains Bird Conservation Region 3
| No. | Site | Study Area Size (effort) | Dominant Species2* | Survey Type3 | Measure of Abundance4 | Year(s) of Study | Reference(s) |
|---|---|---|---|---|---|---|---|
| 24 | Arctic Coastal Plain | 73,348 km2 (unknown # of rapid plots, intensive plots) | AMGP, SESA, PESA, DUNL, LBDO, RNPH, REPH (12 other less common) | PRISM, most 16-ha plots plus intensive validation plots | P: NPR–A = 4,540,047; Prudhoe Bay = 1,431,007; Arctic Refuge = 307,611; Total = 6,278,665 | 1998– 2004 | Bart et al. 2013 |
| 25 | Teshekpuk Lake Special Area | 4,550 km2 (167 rapid plots) | SESA, PESA, DUNL, RNPH, REPH (8 other less common) | PRISM, 16-ha plots | P: 573,274 ± 38,718 (1 SE) | 2006– 2008 | Andres et al. 2012a |
| 26 | Arctic National Wildlife Refuge– Coastal Plain | 674,000 km2 (197 rapid plots, intensive plots) | AMGP, SESA, PESA, RNPH, REPH (9 other less common) | PRISM, 16-ha plots plus intensive validation plots | P: 104,122– 362,938 | 2002, 2004 | Brown et al. 2007 |
| 27 | Cape Krusenstern National Monument and Noatak National Preserve | 13,000 km2 (149 polygons) | REKN, AMGP, SURF (11 other less common) | Area search, 15–700-ha polygons on ridges and domes | D: REKN = 0.31–0.62 pairs/ km2; O: REKN = 13% of polygons | 2010 | Johnson et al. 2010a |
| 28 | Cape Krusenstern National Monument (Kakgrak Hills, Tahinichok Mountains) | Kakgrak: 48 points on 4 transects, 25 km total length), Tahinichok: 36 points on 3 transects over 3 townships | AMGP, BARG, WHIM, WISN, REKN | Accessible townships, transect with point counts | O: Kakgrak = 12.5–77% of points Tahinichok = 21–47% of points | 1996 | Gill et al. 1996 |
| 29 | Arctic Network of Parks (Cape Krusenstern National Monument, Noatak National Preserve, Kobuk Valley National Park, Gates of the Arctic National Park and Preserve) | 67,800 km2 (1,647 points at 69 sites) | AMGP, LEYE, WATA, WHIM, BARG, SURF, SESA, BASA, PESA, LBDO, WISN (11 other less common) | Random 10 km x 10 km grid, point counts, all areas ? 100 m in elevation and < 30° slope | O: 0.1–13.8% of points | 2001– 2003 | Tibbitts et al. 2006 |
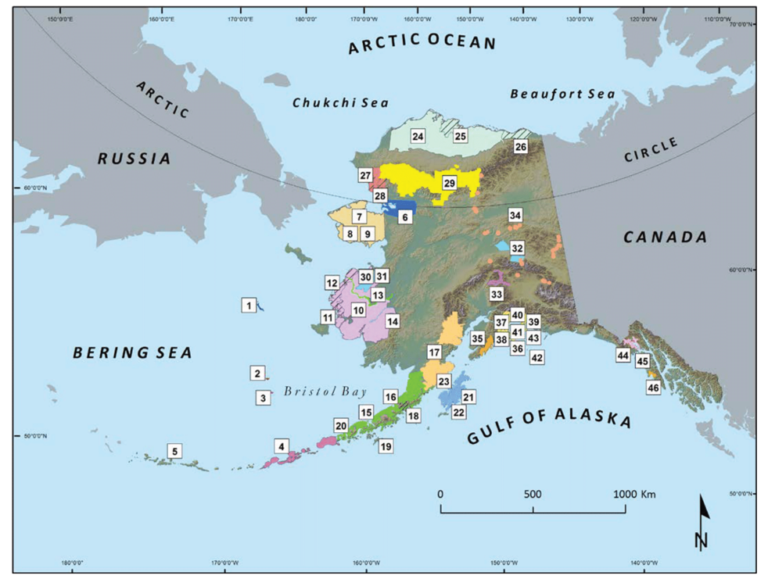
Data compiled by R. Lanctot and R. Gates, and accompanying map created by S. Saalfeld. Coverage excludes Breeding Bird Survey routes, Alaska Landbird Monitoring Survey plots, North Pacifc Pelagic Seabird Database, and small-scale breeding studies. See Figure 11 for location of sites in Alaska.
1aThe northern half of these transects is located in BCR 4.
1bSome sites in southern Nulato Hills are located in BCR 2.
2*Species that are numerically dominant are listed. See Appendix 1 for scientifc names. AMGP = American Golden-Plover, BARG = Bar-tailed Godwit, BBPL = Black-bellied Plover, BLOY = Black Oystercatcher, BLTU = Black Turnstone, BTCU = Bristle-thighed Curlew, DUNL = Dunlin, GRYE = Greater Yellowlegs, LBDO = Long-billed Dowitcher, LESA = Least Sandpiper, LEYE = Lesser Yellowlegs, PAGP = Pacifc Golden-Plover, PESA = Pectoral Sandpiper, REKN = Red Knot, REPH = Red Phalarope, RNPH = Red-necked Phalarope, ROSA = Rock Sandpiper, SBDO = Short-billed Dowitcher, SEPL = Semipalmated Plover, SESA = Semipalmated Sandpiper, SOSA = Solitary Sandpiper, SPSA = Spotted Sandpiper, SURF = Surfird, WATA = Wandering Tattler, WESA = Western Sandpiper, WHIM = Whimbrel, WISN = Wilson’s Snipe.
2aSurveyors were unable to count Black Oystercatchers on the shore due to fog and rugged topography that made accurate counts impossible.
3Survey type includes basic description of methods used to count birds. PRISM = Program for Regional and International Shorebird Monitoring. See references for more details.
4Measure of abundance prioritized by listing population estimate frst (P, with species, confdence interval [CI], coefcient of variation [CV], standard error [SE], and range provided in some cases), then density (D), number observed (N), and then occurrence (O). Number of individuals (ind) and observations (obs) given where relevant. Measures reflect value for all species observed unless species stated. See references for values of individual species.
4aThis count includes birds counted by Tessler and Garding 2005.
*All content and related citations can be found in the Alaska Shorebird Conservation Plan, Version III.
Suggested Citation:
Alaska Shorebird Group. 2019. Alaska Shorebird Conservation Plan. Version III. Alaska Shorebird Group, Anchorage, AK.